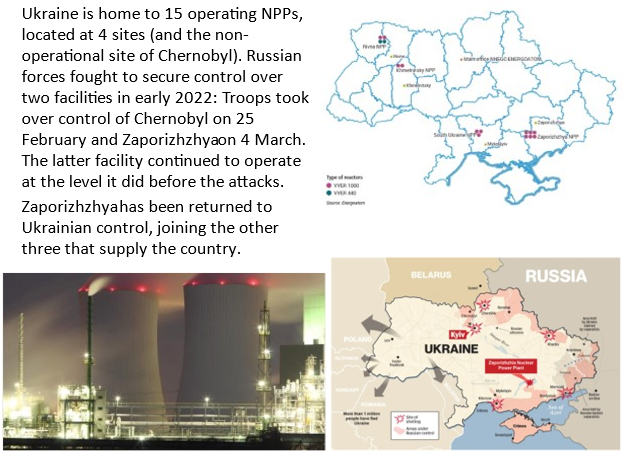
Figure 1. Ukraine's nuclear power plants and Russian actions, 2022. Map upper right from World Nuclear Association, found at https://www.world-nuclear-news.org/BlankSiteASPX/media/WNNImported/mainimagelibrary/places/Ukrainemap730411_WNA.jpg?ext=.jpg; bottom left graphic Russia Seizes Ukraine Nuclear Plant after Fire, Georgia Today, Zaporizhzhia Fire, found at https://georgiatoday.ge/wp-content/uploads/2022/03/thumbs_b_c_6af7db0f8f30b13ff594f2f0bc70cd86.jpg; bottom right map, New York Post, What does Russia’s seizure of Ukraine’s largest nuclear power plant mean? Map found at https://nypost.com/wp-content/uploads/sites/2/2022/03/russian-control-ukraine-nuclear-plant-07.jpg?quality=90&strip=all
In a more down-to-earth, immediate way, let's think about a very recent challenge. Russia early on in the war seized and occupied the no longer used facility at Chernobyl, and the largest nuclear power plant in Europe at Zaporizhzhya. Russia seized the plants using force, continued to occupy them, and has now returned them to Ukrainian control. I want to talk about the fact that we have to think about what was really happening here. There were a lot of questions when Russia first took these—what were they doing? And I would argue that actually Russia's longer term strategic challenge here was that as a major exporter of nuclear energy equipment and nuclear energy technology, Russia absolutely could not afford for a nuclear power plant to be collateral damage in this ground war. The seizure and occupation of Zaporizhzhya and Chernobyl, in my estimation, were an effort to make sure that there would not be collateral damage to the facilities.
Russia is notoriously bad at targeting. When we look at the Chechen wars, we see that in the prosecution of the wars in Chechnya, Russia actually did more damage to their own energy infrastructure through poorly targeted bombings than the Chechens did to Russia. We can see this, and I believe we should understand this situation, as Russia trying to make sure that they would have the energy assets necessary to govern the territory and keep the lights on if they had succeeded in what they thought was going be a rapid conquest of Ukraine. Now the mistakes they made at Chernobyl, we can pick up in the Q&A. There were clearly some substantial mistakes that they made, but I do believe that making sure the facilities themselves were not damaged was an important priority in Russian strategic thinking (refer to Figure 1).
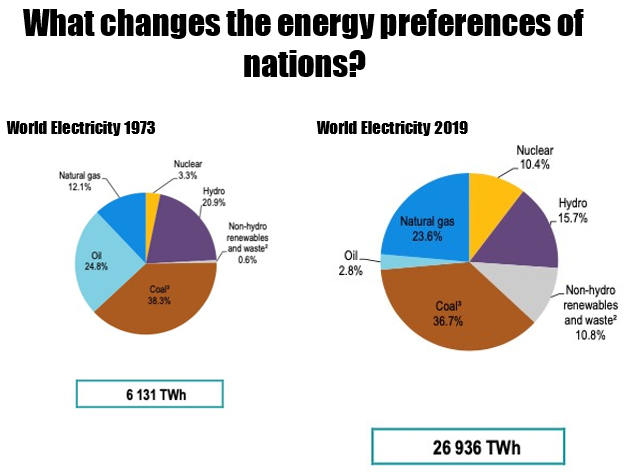
Figure 2. What changes the energy preferences of nations? Source: IEA Key World Energy Statistics 2021, p. 30, found at https://iea.blob.core.windows.net/assets/52f66a88-0b63-4ad2-94a5-29d36e864b82/KeyWorldEnergyStatistics2021.pdf
There are many things that change the energy preferences of nations. Russia wanted to make sure that collateral damage to a nuclear power plant would not reduce world appetite for nuclear-produced electricity, but if we look across time and we compare 1973 to 2019, we see something very curious. What we see here is that the demand for electricity in the world went up more than four times between those time periods. But we also see that what we put into our electricity has changed since, in some interesting ways, and has remained the same, in some interesting ways.
Look at coal. Even though world demand went up four times, so the pie got four times bigger, coal retained the same size share, and we're only now beginning to talk about how to use less coal rather than continually more. Look at natural gas; natural gas used to be a much smaller piece of a much smaller pie. It's gotten extremely important due to some of the environmental advantages, due to some of the efficiency advantages, and due to our better understanding about how to manage and move around natural gas. Look at nuclear. Nuclear at the beginning in 1973, the first oil crisis, nuclear was a very small niche technology, and now it's a very stable ten percent of global supply. And of course, look at non-hydro renewables, which have grown enormously. Many things contribute to changing the preferences of states in the way that states pursue their energy. Sometimes what changes the preferences has unexpected follow-on consequences (refer to Figure 2).
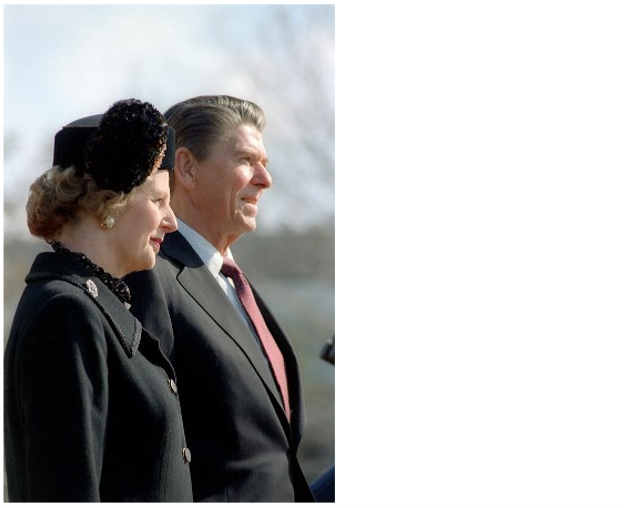
Figure 3. Enduring alliances, Thatcher and Reagan soul mates? Image found at https://upload.wikimedia.org/wikipedia/commons/thumb/c/c8/Thatcher_-_Reagan_c872-9.jpg/597px-Thatcher_-_Reagan_c872-9.jpg?20190923014244
Europe is now in what I would argue is their third major energy transition. The first one was the transition from coal to oil in the naval ships of the United Kingdom, and that took place under Churchill when he was first Lord Admiral of the Navy. But the second transition took place in the late ’70s, early ’80s, and was part of a big dispute between Margaret Thatcher and Ronald Reagan. Even though these two characters agreed on a lot of things about the appropriate size of government and role of government, they fundamentally disagreed on an important issue.
Margaret Thatcher was a proponent of importing natural gas to Europe, of shifting the energy basis of Europe onto natural gas. To Ronald Reagan this was the worst sort of strategic stupidity. Why would you develop a dependence on your adversary? Why would you make a set of choices that physically connect you to an adversary? Because Margaret Thatcher's argument really carried the day, it's important to review that argument. Her argument was that Europe was dependent in a very unbalanced and dangerous way on the Middle East. Diversifying from this very high dependence on oil into a mixed dependence on oil and gas would diversify the portfolio of risk. Even though there would be Soviet risk, there would be Soviet risk and Middle Eastern risk instead of all Middle Eastern risk. In addition, natural gas had some phenomenal advantages, and Europe was very densely populated and trying to find ways to preserve air quality. There were environmental reasons.
But in the end, Europe did what Europe usually does, and the United States did what the United States usually does (refer to Figure 21). The United States sanctioned and embargoed the pipeline and Europe built it anyway. Interestingly, in an effort to make sure that their dependence on the Soviet Union was not too high, Europe also led exploration for new gas, and that led to developments in Algeria that led to North Sea gas development. All the way until 2004, Europe managed to retain its commitment to become no more than 30 percent reliant on natural gas from the Soviet space or from Russia (refer to Figure 5).

Figure 4. Enduring alliances, or contentious strategic choices? Source: Foreign Affairs, 1982, Vol. 61, No. 3, pages 511-540, Andrew Knight, Ronald Reagan’s Watershed Year? found at https://doi.org/10.2307/20041540. Accessed 23 Jun. 2022.
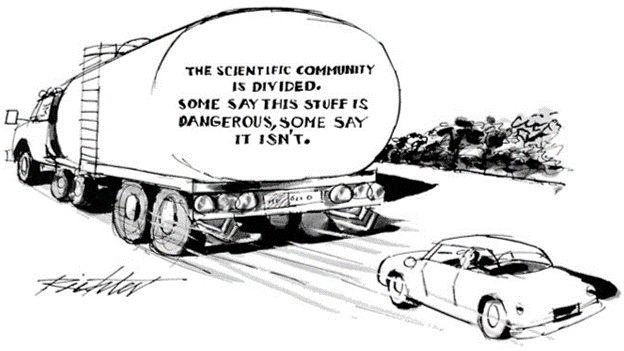
Figure 5. The scientific community is divided. Source: New Yorker Cartoon Bank. Source: The New Yorker, by Mischa Richter, 21 March 1988, found at https://images.fineartamerica.com/images-medium-large-5/the-scientific-community-is-divided-some-say-mischa-richter.jpg
What we see here, as we look across time, is that as strategists, we are forced to compare unlike risks. It's really complicated and problematic because when you think about it, what we're doing here is we're trying to figure out not only how much risk there is, but how we compare environmental risk to political risk to technological risk to economic risk. And we find that there is no consensus. We're having to continuously readjust (refer to Figure 6).
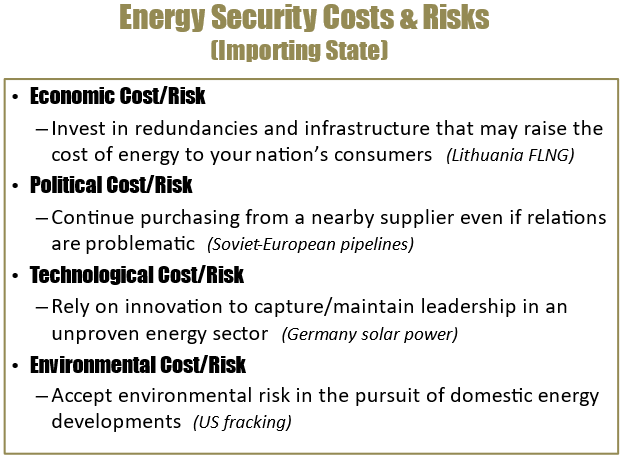
Figure 6. Energy Security Costs & Risks [Importing State]
What we see, and what strategists know, is that costs are what you know you are going to pay, risks are what you're going to pay when you're wrong. When we think about how to balance economic cost and risk, we see that Lithuania was willing to incur huge cost economically to reduce what they perceived as political risk. We see that the Soviet-European pipelines were willing to incur a new kind of political risk in an effort to reduce another kind of political risk but also in an effort to make some technological change. When we look at what has happened in Germany in recent years, we see that Germany was willing to lead the world, which they did for many years, in solar power, and was willing to incur a lot of technological cost and risk in order to try to capture and maintain leadership in a new and—what they believed—an important energy sector. We also see, for example, in the United States, we exempted horizontal drilling and fracking from environmental restrictions in an effort to capture a technological lead and shift our energy dependency. That was a willingness to incur significant environmental cost and risk. States shift these regularly over time and over space trying to get that ideal balance, and that has an impact not only on energy security but on broader political thinking and on strategy. When we think about that sort of willingness to the United States to really push the envelope on technological, and frankly on environmental, risk in order to capture natural gas, it's worth going back and asking: Why did we do that? Why would we do that (refer to Figure 7)?
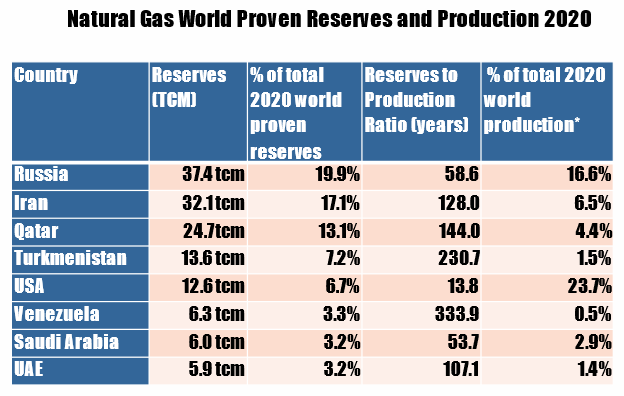
Figure 7. Natural gas world proven reserves and production 2020 (* Excludes gas that is flared or reinjected. Source: BP Statistical Review of World Energy July 2021, British Petroleum [at end of 2020] in TCM, pp 34 & 36, found at https://www.bp.com/content/dam/bp/business-sites/en/global/corporate/pdfs/energy-economics/statistical-review/bp-stats-review-2021-full-report.pdf
Now when we look at the United States, what we see is something rather extraordinary, and that is the United States does not have the highest level of proven reserves in the world; as you can see here, we're currently number five on the list. You see that we hold almost seven percent of the proven reserves in the world, and yet somehow, we're the largest producer in the world now. What does that mean for us? Well, if you looked at the reserves to production ratio column, what you see is that the United States can only continue to produce natural gas the way we are now, at the rate we are now, for fourteen years, unless we continually innovate, continually use new technologies, continually find new resources. We do not have enormous amounts of this reserve. The reserves to production ratio does not mean that we're going to completely run out of gas in fourteen years. It means that the United States has chosen a path where we're committed to continually innovating, continually incurring this technological risk, in an effort to produce at the rate that we are. That may seem like an odd choice. I want to show you both why we began going down this route and what the new challenge is (refer to Figure 8).
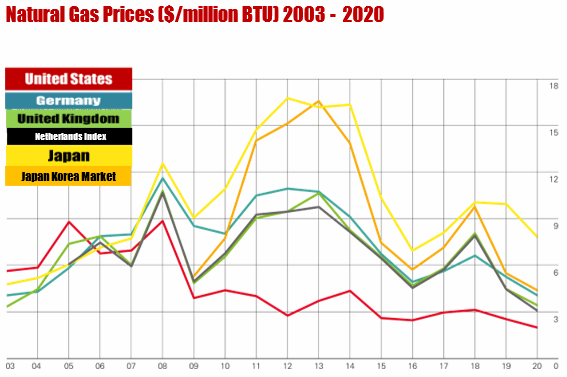
Figure 8. Natural gas prices ($/million BTU) 2003–2020. Source: Statistical Review of World Energy 2021, p. 41, found at https://www.bp.com/content/dam/bp/business-sites/en/global/corporate/pdfs/energy-economics/statistical-review/bp-stats-review-2021-full-report.pdf.
What you see if you look at the year 2012 is that at that time, for the same unit of natural gas where the United States was paying less than $3, Japan was paying more than $16. Think about how huge that is, and if natural gas is an important industrial component to what you're doing, that matters hugely. Well, what you're seeing there is that being close to gas has a huge economic advantage. Moving gas around costs more than getting it out of the ground. If you are near where the gas is, that has huge strategic implications. The United States captures this enormous economic advantage. But if you look at that chart going toward the right, what you see is that the prices are getting closer and closer together (refer to Figure 9).
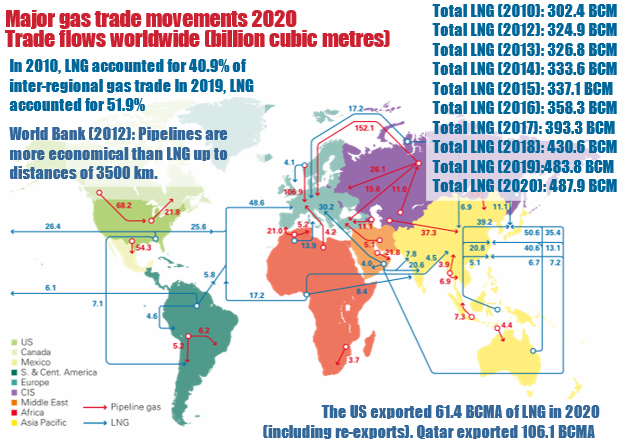
Figure 9. Major gas trade movements 2020, Trade flows worldwide (billion cubic meters). Source: Image and data from BP Statistical Review of World Energy 2021, p. 33, 42 44, found at https://www.bp.com/content/dam/bp/business-sites/en/global/corporate/pdfs/energy-economics/statistical-review/bp-stats-review-2021-full-report.pdf and includes data from FGE MENAgas service, HIS.
It used to be that natural gas was purely a regional commodity, so if you were close to it, you win. As we move gas more and more into sea lanes and less and less in pipelines, what we're seeing is the transformation of the global markets. what we see is more than half the gas in the world is now moved in the sea lanes. Thus, a change in price in one place immediately has an impact on a change in price elsewhere. The world has reduced the political risk associated with overland pipelines where you have long-term contracts, but that's increased the economic risk and the economic volatility. In a sense, the whole world has traded some political risk in natural gas for heightened economic risk and gas. Let’s look at another way that risk is shifting (refer to Figure 10).
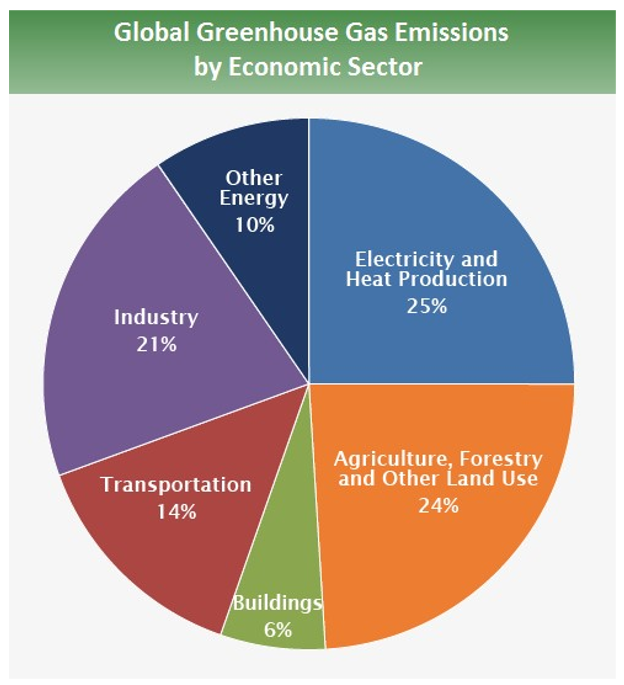
Figure 10. Global greenhouse gas emissions by economic sector. Source: EPA Global Greenhouse Gas Emissions 2014, https://www.epa.gov/ghgemissions/global-greenhouse-gas-emissions-data.
When we look at the greenhouse gases that cause global warming, what we see is that no matter how you count it, at least fifty percent and as much as seventy percent of the greenhouse gases emitted in the world are associated with energy. Energy is not the only contributor to greenhouse gases and global warming, but there is no way to address global warming unless we incorporate greenhouse gases into our calculus. We know that greenhouse gas emissions are going to change the way that we think about energy, and we can see some evidence from the markets that that's already happening (refer to Figure 11).
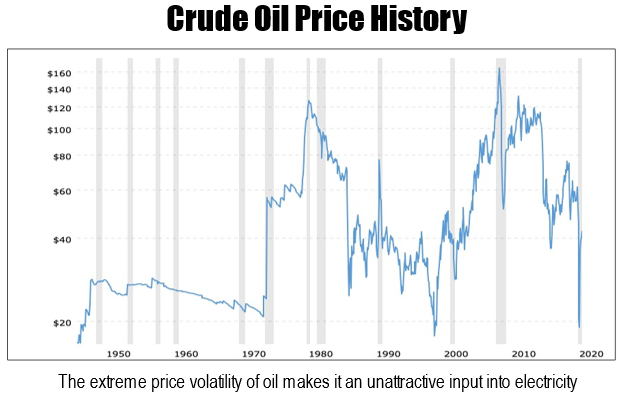
Figure 11. Crude oil price history. Source: Data from EIA. Log scale/Inflation adjusted. Chart from Microtrends.net, found at https://www.macrotrends.net/1369/crude-oil-price-history-chart
Oil has been a problem for a long time in terms of volatility. This shows you how dramatically the price of oil changes and this, by the way, is why we prefer not to use it in electricity because it's so volatile that it makes it really hard to do that minute-by-minute input into a grid that we have to do in order to produce electricity (refer to Figure 12).
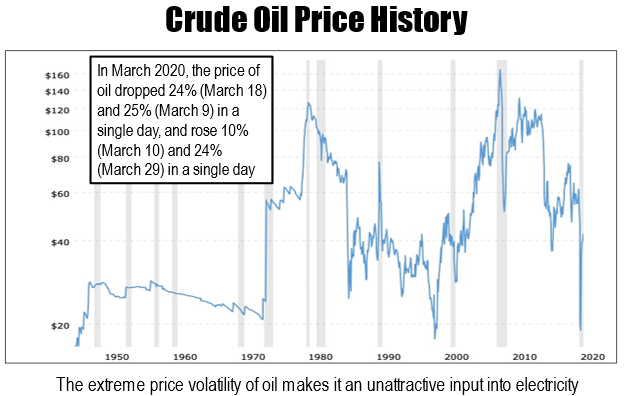
Figure 12. Crude oil price history with price volatility textbox. Source: based on EIA, March 2020 [measuring WTI], found at https://www.macrotrends.net/1369/crude-oil-price-history-chart
But even in a world where oil is profoundly volatile, we've seen new, and even scarier, volatilities. In 2020, during the global economic shutdown in the month of March, we saw something truly extraordinary that this graph (Figure 30) does not capture. We saw that the price of oil fluctuated by more than 20 percent in a single day—three times—and more than 10 percent in a single day, four times. What we're seeing is that as the future of oil becomes more and more uncertain, the volatility, the unpredictability, the craziness of it gets greater and greater, and that is reflected in something that you may or may not have noticed that happened not because of COVID, but it happened during COVID (refer to Figure 13).
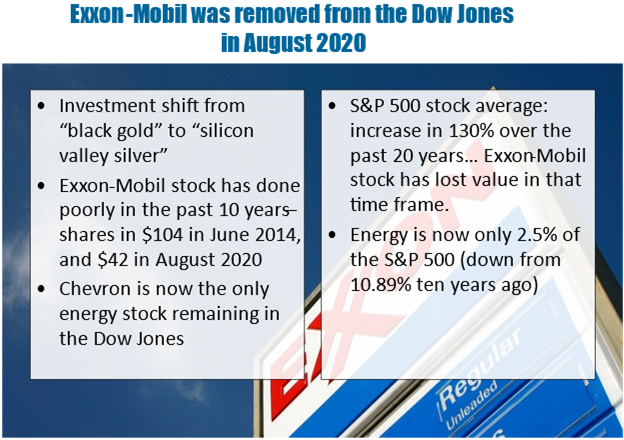
Figure 13. Exxon-Mobil removed from Dow Jones August 2020. Source: Camila Domonoske, NPR, 25 August 2020, Exxon Mobil Exits: The Dow Drops Its Oldest Member, image found at https://img.theepochtimes.com/assets/uploads/2022/06/03/gas-prices-4-700x420.jpg
ExxonMobil is no longer on the Dow Jones. When we look at the Dow Jones, the Dow Jones measures the most important American companies, and ExxonMobil was the longest serving member of the Dow Jones. It was removed in August 2020, not because of a one-time problem with oil prices but because on average, ExxonMobil is a terrible investment. The stock has done extremely poorly in the past ten years. The way oil has behaved is completely different than the way most stocks behave. That's not just in ExxonMobil, and that's not just in the Dow Jones. The Standard and Poor 500, which measures the five hundred most important global companies, has also downgraded oil because on average, stocks have increased 130 percent over a twenty-year period, whereas oil keeps losing value. What we see is that the future of oil is increasingly uncertain. That makes investment really problematic (refer to Figure 14).
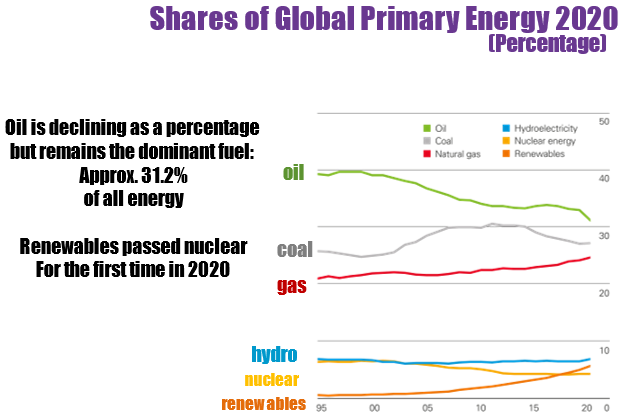
Figure 14. Shares of Global Primary Energy 2020 (percentage). Source: BP Statistical Review of World Energy 2021, p. 12, found at https://www.bp.com/content/dam/bp/business-sites/en/global/corporate/pdfs/energy-economics/statistical-review/bp-stats-review-2021-full-report.pdf.
But at the same time, not only are we not yet done with oil, oil is still the most important energy commodity. When we look at what goes into light and heat in industry, we see that oil is still number one. It's not gone. It's not even number two yet. This creates all sorts of confusing economic dislocations in an incredibly important sector (refer to Figure 15).
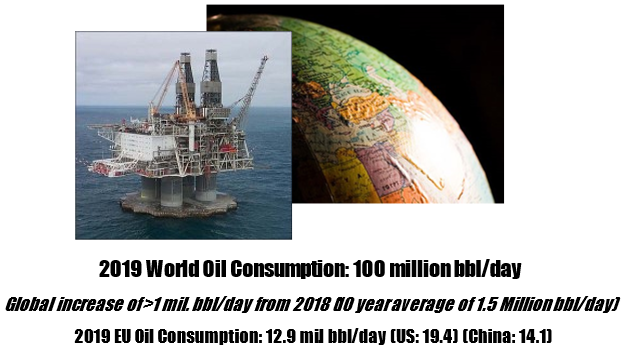
Figure 15. 2019 World oil consumption: 100 million bbl/day. Source: BP Statistical Review of World Energy 2020 and IEA December 2020, data found at https://www.bp.com/content/dam/bp/business-sites/en/global/corporate/pdfs/energy-economics/statistical-review/bp-stats-review-2020-full-report.pdf and https://www.iea.org/reports/oil-market-report-december-2020
For years and years, the reason why the United States was pushing the technological envelope is because there was confidence that every year the world would want one to two million barrels of oil a day more. Everybody, everywhere, was still wanting more (refer to Figure 16).

Figure 16. 2020 World Oil Consumption: 91.1 million bbl/day, Global decrease of 8.1 mil. bbl/day from 2019. Source: BP Statistical Review 2021 and IEA Oil Market Report December 2020 found at https://www.bp.com/content/dam/bp/business-sites/en/global/corporate/pdfs/energy-economics/statistical-review/bp-stats-review-2021-full-report.pdf and https://www.iea.org/reports/oil-market-report-december-2020. Image of COVID-19 found at https://www.fda.gov/files/Coronavirus_3D_illustration_by_CDC_1600x900.png
It wasn't until COVID that we actually saw a downturn in global demand for oil, and everyone was uncertain what that COVID downturn would mean. It was very dramatic, but was it durable? What should investment look like? What should happen? As we tried to recover from COVID, one of the important actors but a very uncertain actor was OPEC Plus. What were we supposed to do with OPEC Plus? (refer to Figure 17).
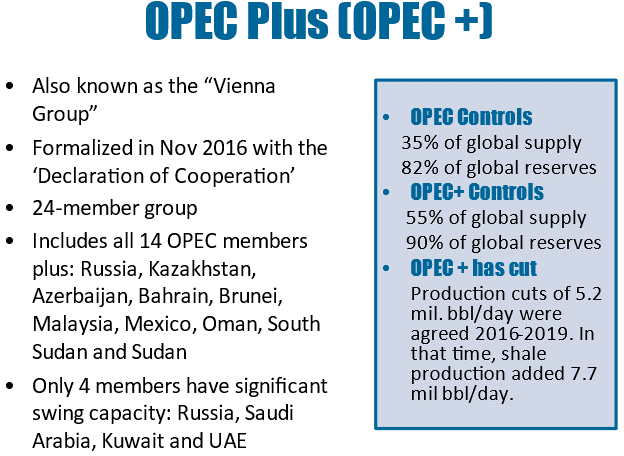
Figure 17. OPEC Plus (OPEC +). Source: OPEC bulletin, found at https://www.opec.org/opec_web/static_files_project/media/downloads/publications/OB11_12%202016.pdf.
For many, many years, we were in a world where OPEC was predominantly Arab, but that shifted. Now we're in a world starting in which OPEC expanded and brought on twenty-four new members and essentially almost all the countries of the world that have a strong state presence in oil united together into OPEC Plus (OPEC+). Russia became the number two player in OPEC+, the second most important after Saudi Arabia. This changed the dynamic of OPEC, and this was a desperate effort on the part of oil-producing states to manage the fact that volatility has gotten so crazy in oil that no one knows what investment should look like. They tried to control volatility by managing production, but every single time OPEC+ cut back, U.S. production surged, bringing the market down again. OPEC+ was not very effective, and they were getting very frustrated. They had a rule, which was when the price of oil dropped below $50 a barrel, they would meet in emergency session and figure out what to do (refer to Figure 18).
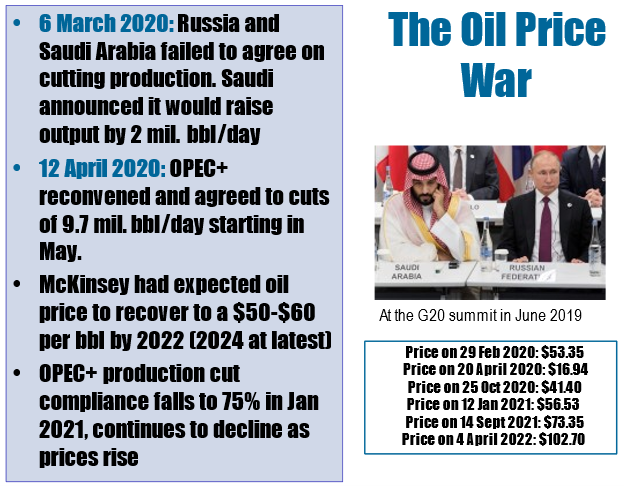
Figure 18. The oil price war. Source: Oil price based on Brent Crude as reported by oilprice.com. Image found at https://newlinesinstitute.org/wp-content/uploads/GettyImages-1152489863-2.jpg
And so in early March 2020, they met in emergency session to figure out what to do, and the emergency session collapsed. Saudi Arabia and Russia could not agree on what to do. Russia left the meeting, and Saudi Arabia decided to flood the world market with oil to teach Russia a lesson. It just so happened that that was the week before the global economy began shutting down due to COVID. That flooded the market, collapsed the market, and created all sorts of instabilities and precipitated uncertainty among the major oil-producing states; they didn’t know how to move forward. The crisis we're facing today, about the Russia invasion of Ukraine, is certainly largely, but it's also about the deep uncertainty in OPEC+ about the future of oil and how to manage how that unfolds (refer to Figure 19).
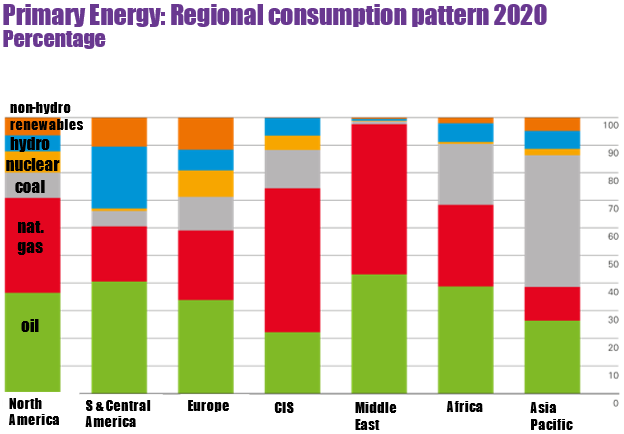
Figure 19. Primary energy: regional consumption pattern 2020 percentage. Source: Statistical Review of World Energy 2021, p. 12, found at https://www.bp.com/content/dam/bp/business-sites/en/global/corporate/pdfs/energy-economics/statistical-review/bp-stats-review-2021-full-report.pdf.
What we see is that we're now in a world where no part of the world is ready to use less energy, but what inputs regions of the world want are shifting dramatically. In the Asia-Pacific, coal is still king. They're trying to move into the age of oil and gas. Europe, already in an age of gas, is trying to move into an age of non-hydro renewables. The Middle East, growing increasingly dependent on gas, is trying to export oil. North America is moving for the first time from the age of oil into the age of gas. Each of these changes in turn changes supply chains, changes dependencies, changes politics, changes the geostrategic implications of various energy sources (refer to Figure 20).
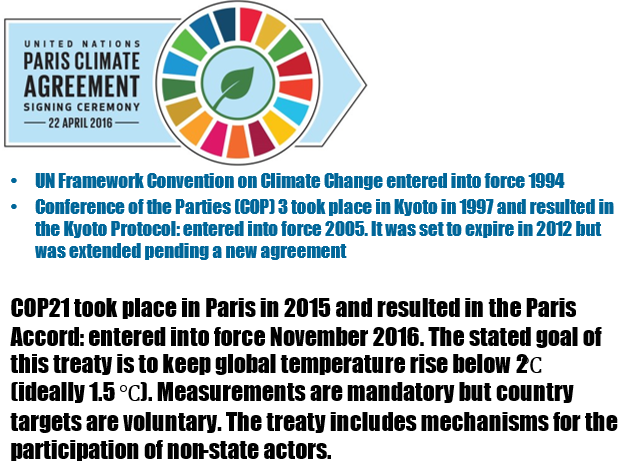
Figure 20. United Nations Paris climate agreement 22 April 2016. Source: data found at https://unfccc.int/process-and-meetings/the-convention/what-is-the-united-nations-framework-convention-on-climate-change and https://unfccc.int/process-and-meetings/the-paris-agreement/the-paris-agreement, graphic found at https://i0.wp.com/www.un.org/sustainabledevelopment/wp-content/uploads/2016/04/Paris-Agreement_Logo_EN_size.png?fit=900%2C408&ssl=1
Of course, we are in an age of climate change, and what we know is that the world is trying to keep global temperature rise below 2 degrees Celsius (refer to Figure 21).
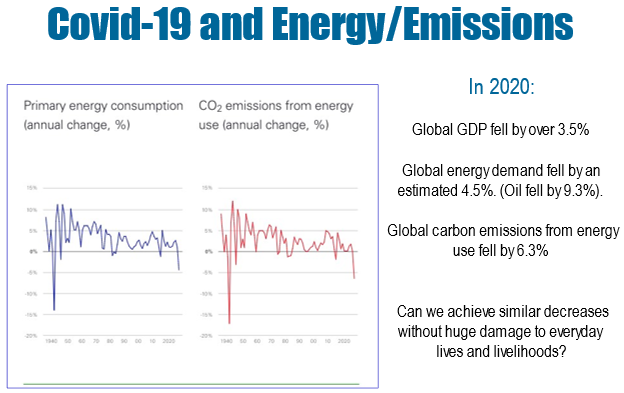
Figure 21. COVID-19 and energy/emissions 2020. Source: Spencer Dale, BP Chief Economist, presentation on 12 July 2021. Source: graphic at https://www.bp.com/en/global/corporate/energy-economics/statistical-review-of-world-energy/chief-economist-analysis.html
If we think about what would we have to do in order to do that, what we saw is that during COVID-19, global energy demand fell by four and a half percent, oil demand fell by nine percent, and carbon emissions fell pretty much in the way that we needed them to fall every year for a number of years. But, during COVID, what we saw is that the global GDP fell by three and a half percent, and the desperate task before us now is how do we get COVID-level reductions in emissions without COVID-level impacts on our economies? We don't have really good answers for that yet, but we know what we need to do (refer to Figure 22).
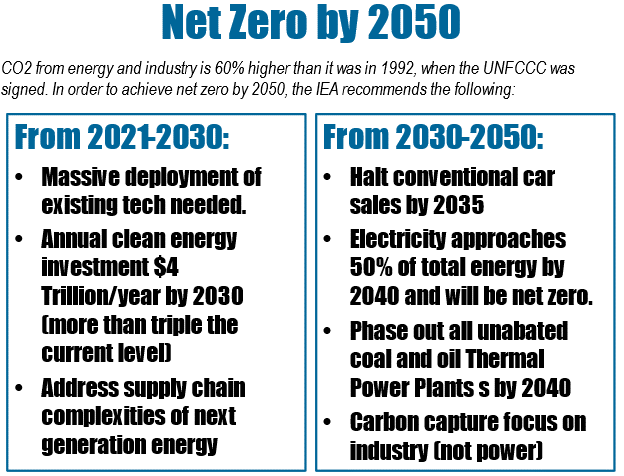
Figure 22. Net Zero by 2050. Source: “Net Zero by 2050” Report by the International Energy Agency, May 2021. Source: https://www.iea.org/reports/net-zero-by-2050
What we need to do, according to the International Energy Agency, which is the agency that helps the Organisation for Economic Co-operation and Development (OECD) think about energy infrastructure, we have to massively deploy existing technology. We need to see far more investment now than we're seeing in existing technologies. We need to get on top of these supply chain complexities. And we need to begin moving more and more and more energy demand onto the grid. Electrifying it so that by 2040, half of our energy that we use is in the form of electricity. This is a complex process—a huge challenge. We are only beginning to move toward it. And of course, the war has shifted our short-term priorities, although in the end the war may hasten the transition away from oil and gas because of the critical role Russia plays with that.
The views expressed are those of the author(s) and do not reflect the official policy or position of Joint Forces Staff College, National Defense University, the Department of Defense, or the U.S. Government.
 Download the PDF version: Part 1, Part 2